Toolkits · Read the trend
Rider Algo #2 — Trend Detection
MembersShows the long-term trend at a glance and when it has turned, with weekly and monthly context.
Best on: 1D, 1W, 1M
Included in Rider Algo Toolkit and Full Strategy Access
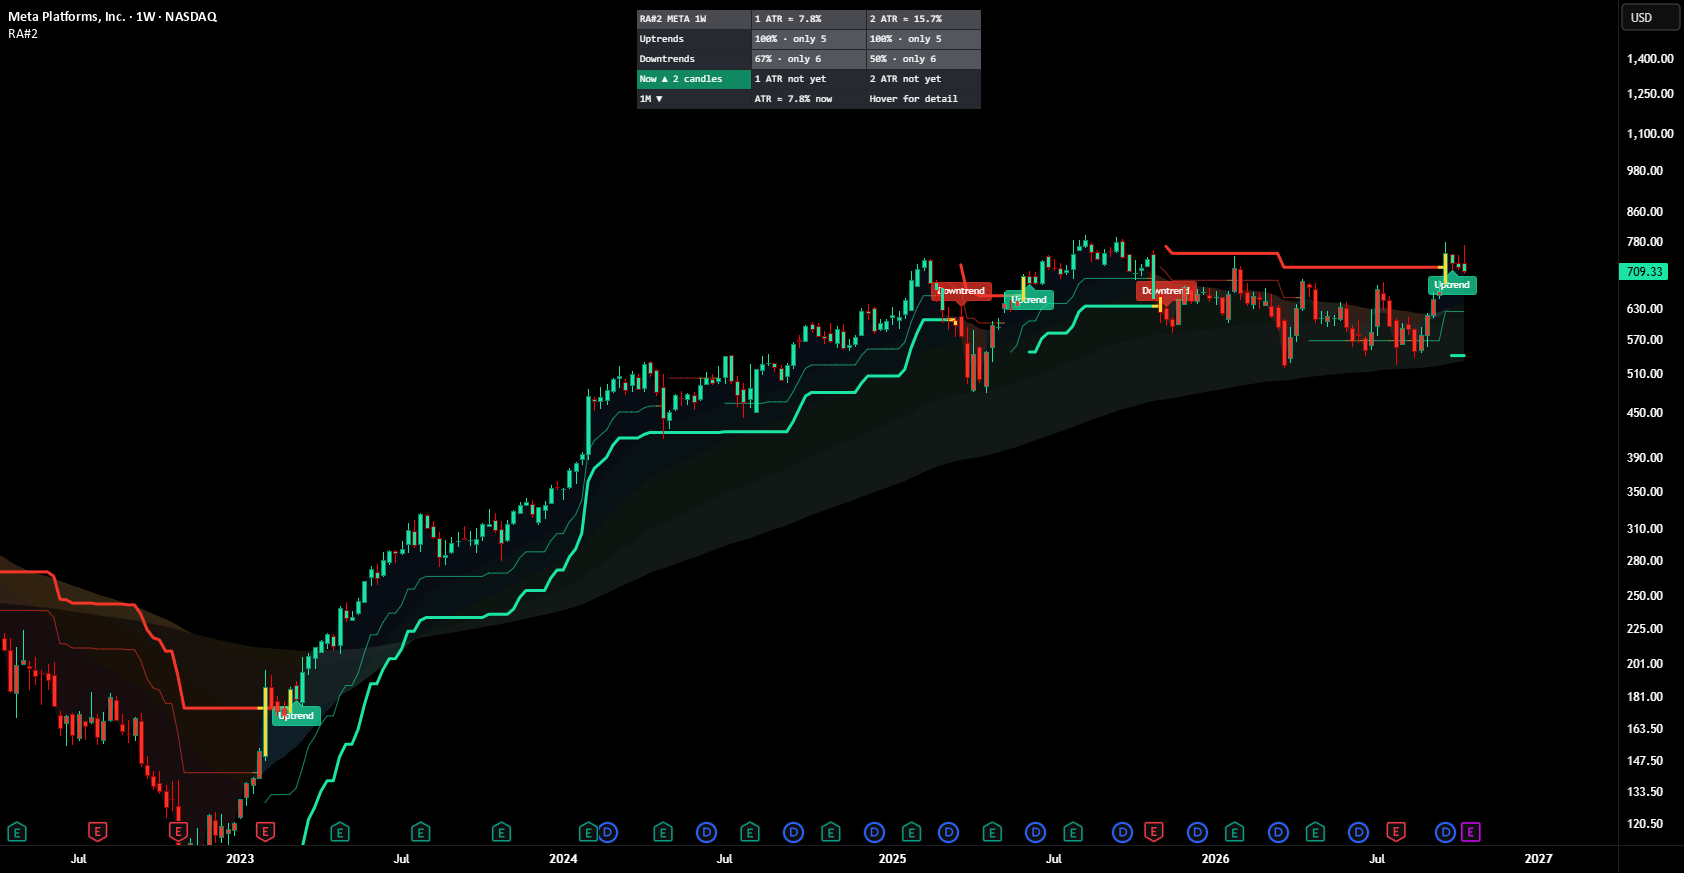
What it does
Rider Algo #2 tells you, at a glance, which way the long-term trend is going and when it has turned. The trend line and the candles take the color of the trend: green while it is up, red while it is down, and yellow while a possible turn waits to be confirmed. Think of it as a traffic light for the trend.
How to read it
- Start from the top: check the weekly and monthly arrows in the table, then the color on your chart. When they agree, the trend has the widest backing.
- Green or red is a confirmed trend. The line only moves in the direction of the trend.
- Yellow is a warning, not a signal: wait for the confirmation or for price to close back inside.
- The thin short-term line shows pullbacks inside the bigger trend.
- The table shows whether past trends on this chart traveled far enough to matter.
When to use it
- To know which side you should be on before using any other tool.
- On 1D, 1W and 1M charts, where a confirmed change of color is a significant event.
When not to use it
- For quick scalps on very low timeframes.
How we tested it
Every confirmed trend on the chart you open is judged when it ends, at one and two ATR moves, and the table shows the result for uptrends and downtrends separately.