Toolkits · Read the trend
Moving Average Master
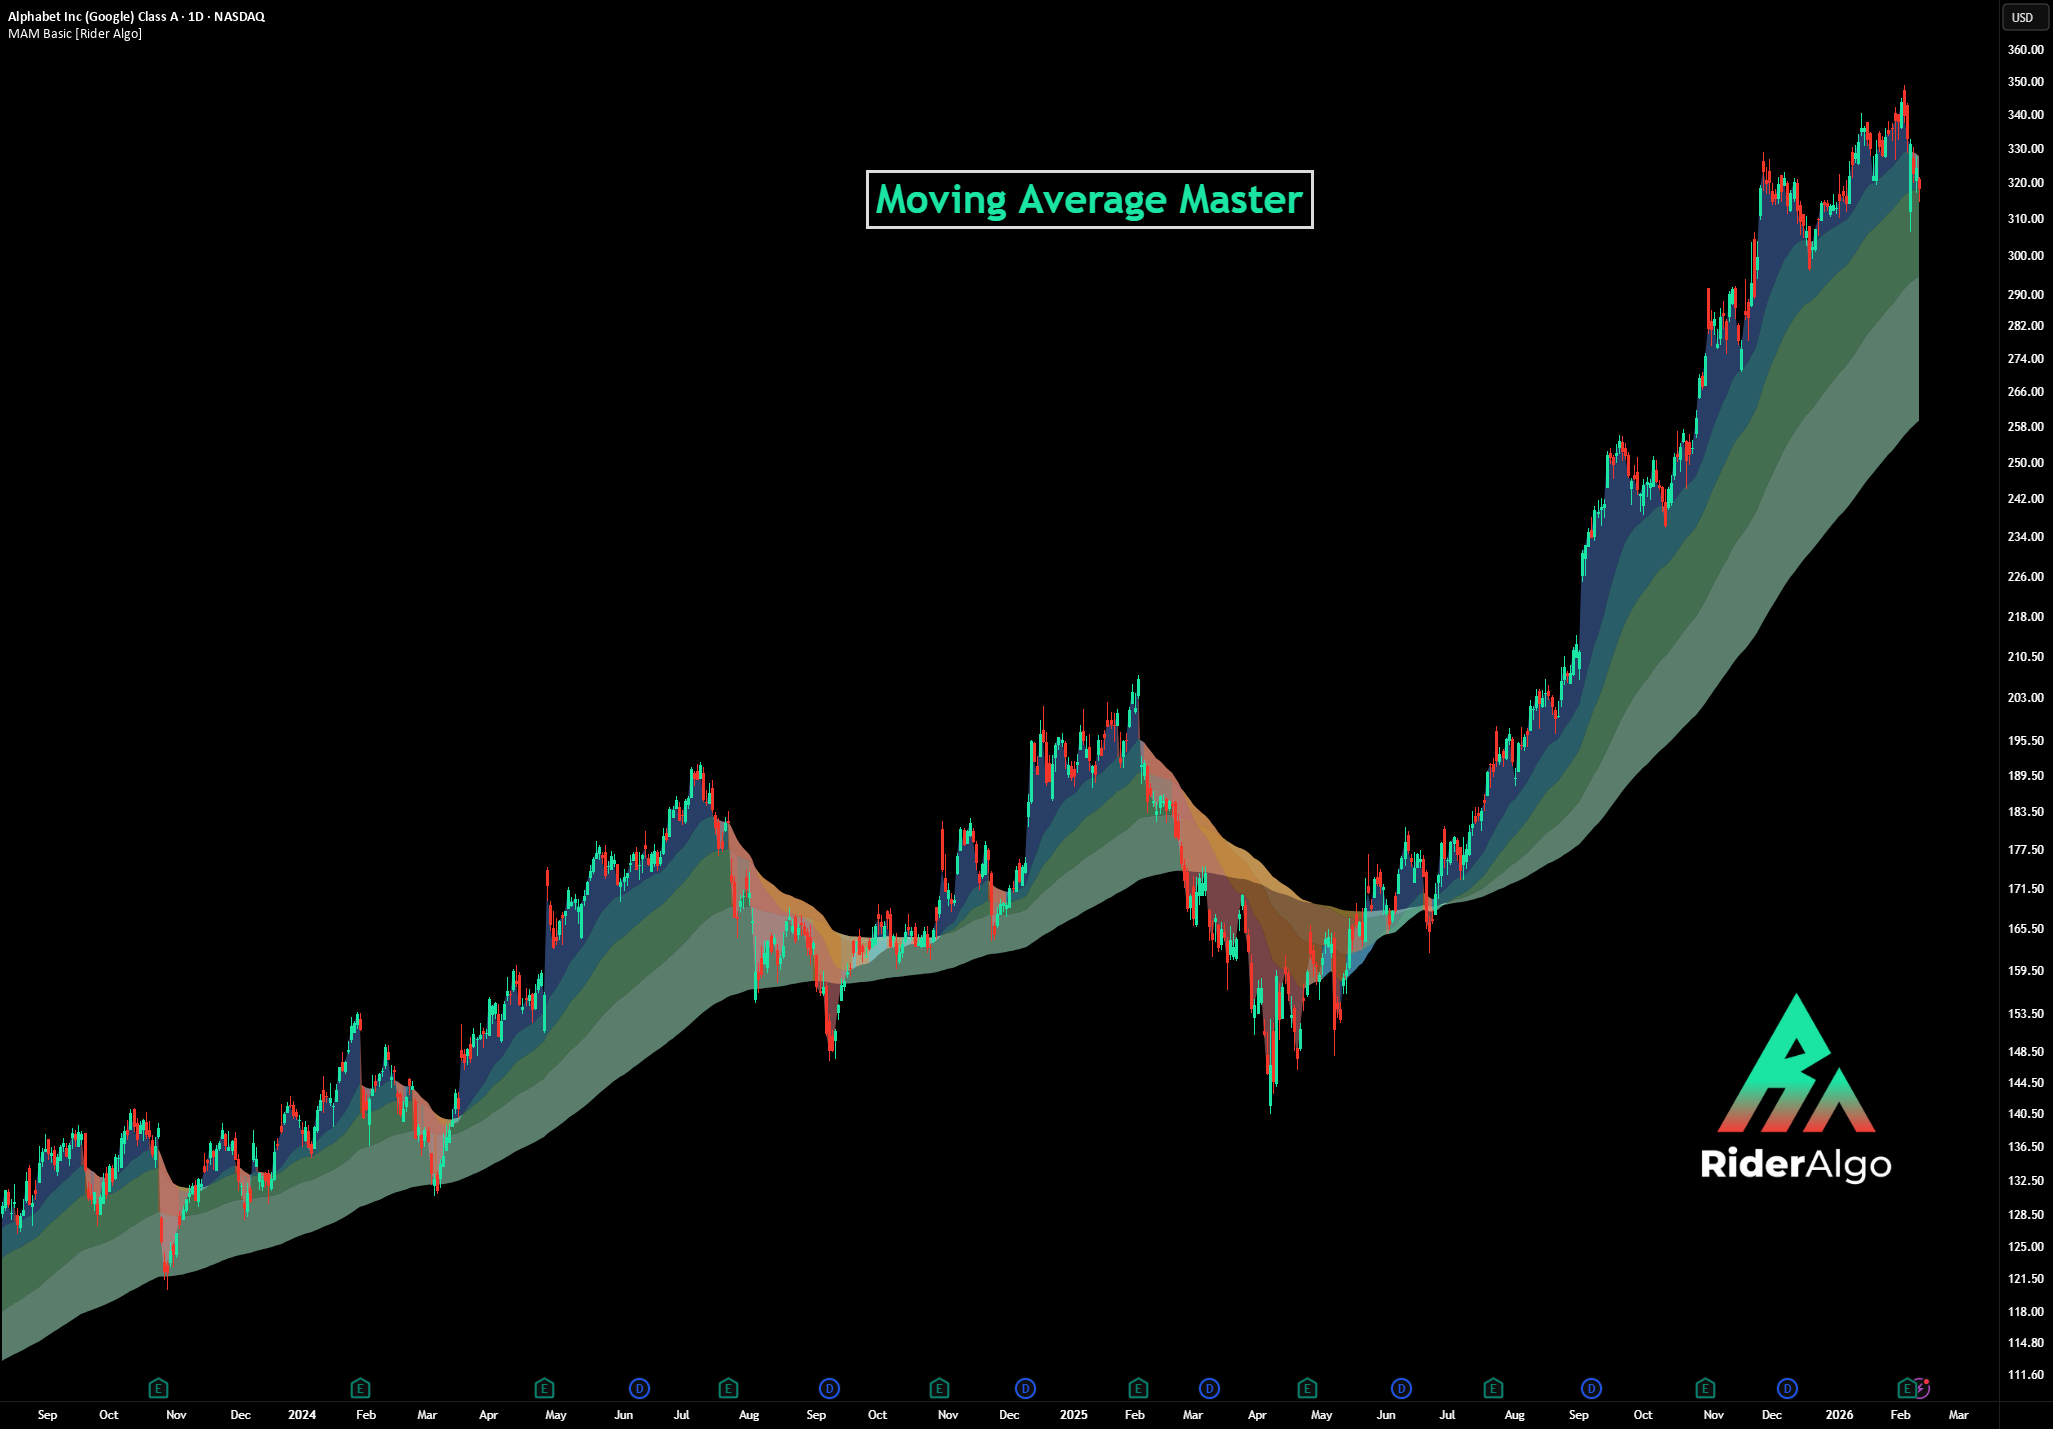
FreeColors the space between price and the EMA 25, 50, 100 and 200 so you see the trend and its supports at a glance.
What it does
Moving Average Master paints color bands between price and four key moving averages (EMA 25, 50, 100 and 200). Cool colors when price is above each average, warm colors when it is below. It works like a trend heat map on your chart.
How to read it
- All bands cool: price is above every average. Strong uptrend, and each average below can act as support.
- All bands warm: price is below every average. Strong downtrend, and each average above can act as resistance.
- Mixed bands: the trend is changing or the market is consolidating. Watch the bands flip one by one.
- The EMA 100–200 band is the last line of defense. When it flips, the bigger trend is likely changing.
When to use it
- To confirm entries from other signals: with every band bullish, you have the wind at your back.
- As moving supports and resistances instead of fixed horizontal lines.
When not to use it
- In tight ranges, where price crosses the averages back and forth.