Toolkits · Momentum
Rider Algo #4 — Oscillators Pro
MembersMomentum, money flow and the higher timeframe in one pane, with a table that tells you which signals to trust.
Included in Rider Algo Toolkit and Full Strategy Access
What it does
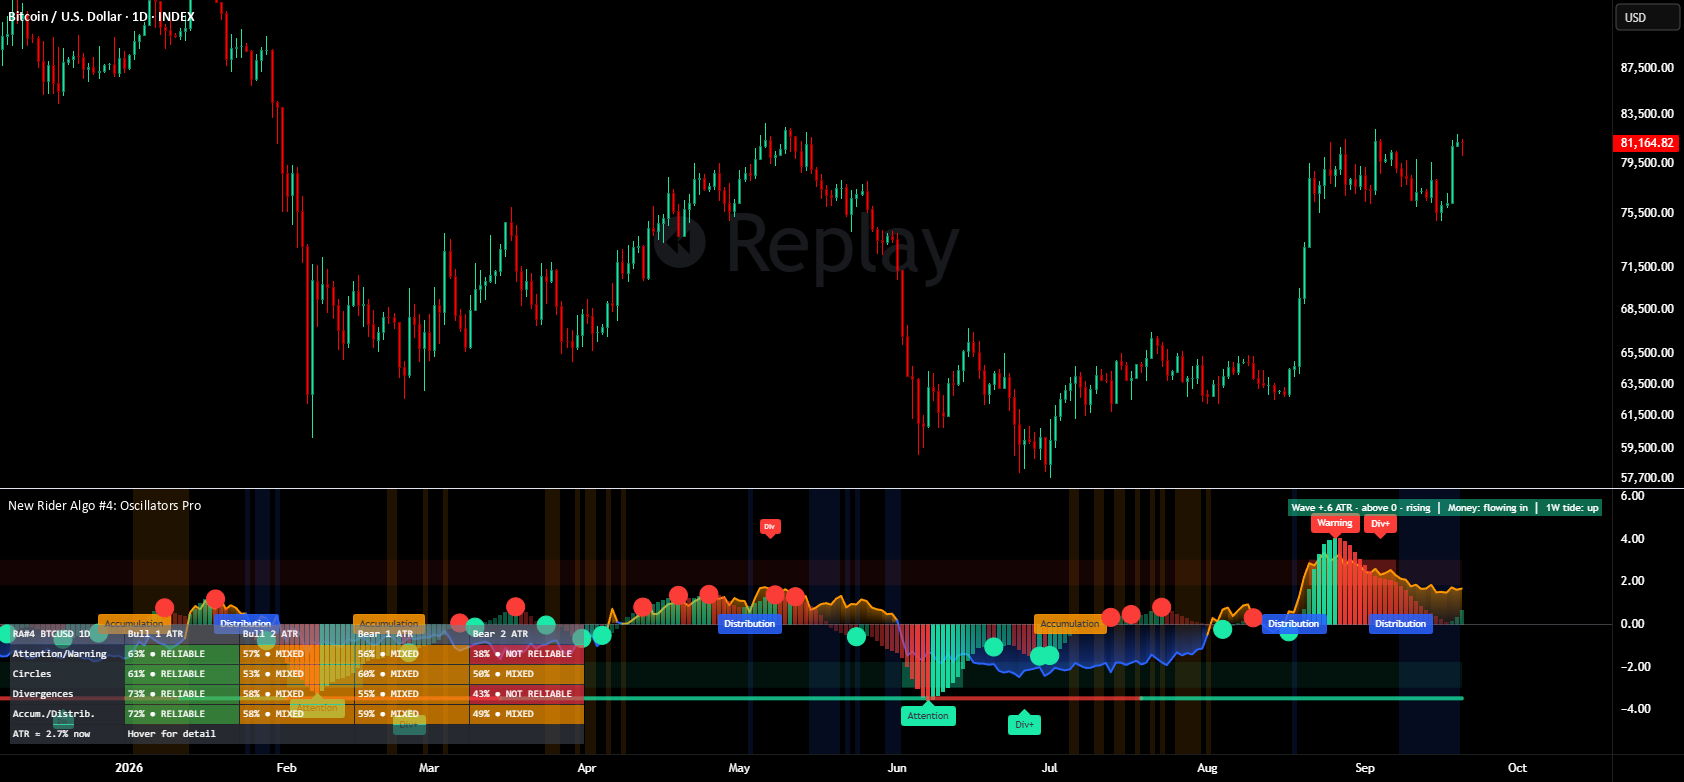
Rider Algo #4 Pro puts momentum, money flow and the bigger picture in one pane, and reads them for you in plain words. It shows how stretched price is, when that stretch starts to turn, whether money is coming in or leaving, and what the higher timeframe is doing. The Pro version adds a reliability table for every signal.
How to read it
- Read the status line and the tide strip first: where the wave is, which way money is moving and which way the higher timeframe is going.
- Check the table to see which signals have been reliable on this chart. Markers rated NOT RELIABLE fade, so the chart tells you what to trust.
- Attention / Warning are the most valuable signals: the wave turns inside an extreme zone, so the stretch is starting to fade.
- Circles mark everyday turns of the wave. Read them together with the money flow.
- Shaded background marks accumulation or distribution: price moving sideways while money quietly comes in or leaves.
When to use it
- To time entries and exits inside a trend you already identified.
- Together with Rider Algo #1 on the price chart: they share the same momentum engine.
When not to use it
- To decide the trend direction on its own: pair it with a trend tool.
How we tested it
Everything is measured in ATR, so levels mean the same on any asset. The table judges each signal on the chart you open, at one and two ATR moves over the next ten candles.