Strategies · Momentum
Strategy #4 — Overextended Assets
MembersTurns RSI overbought and oversold levels into price lines and marks the first pullback after a breakout.
Included in Full Strategy Access
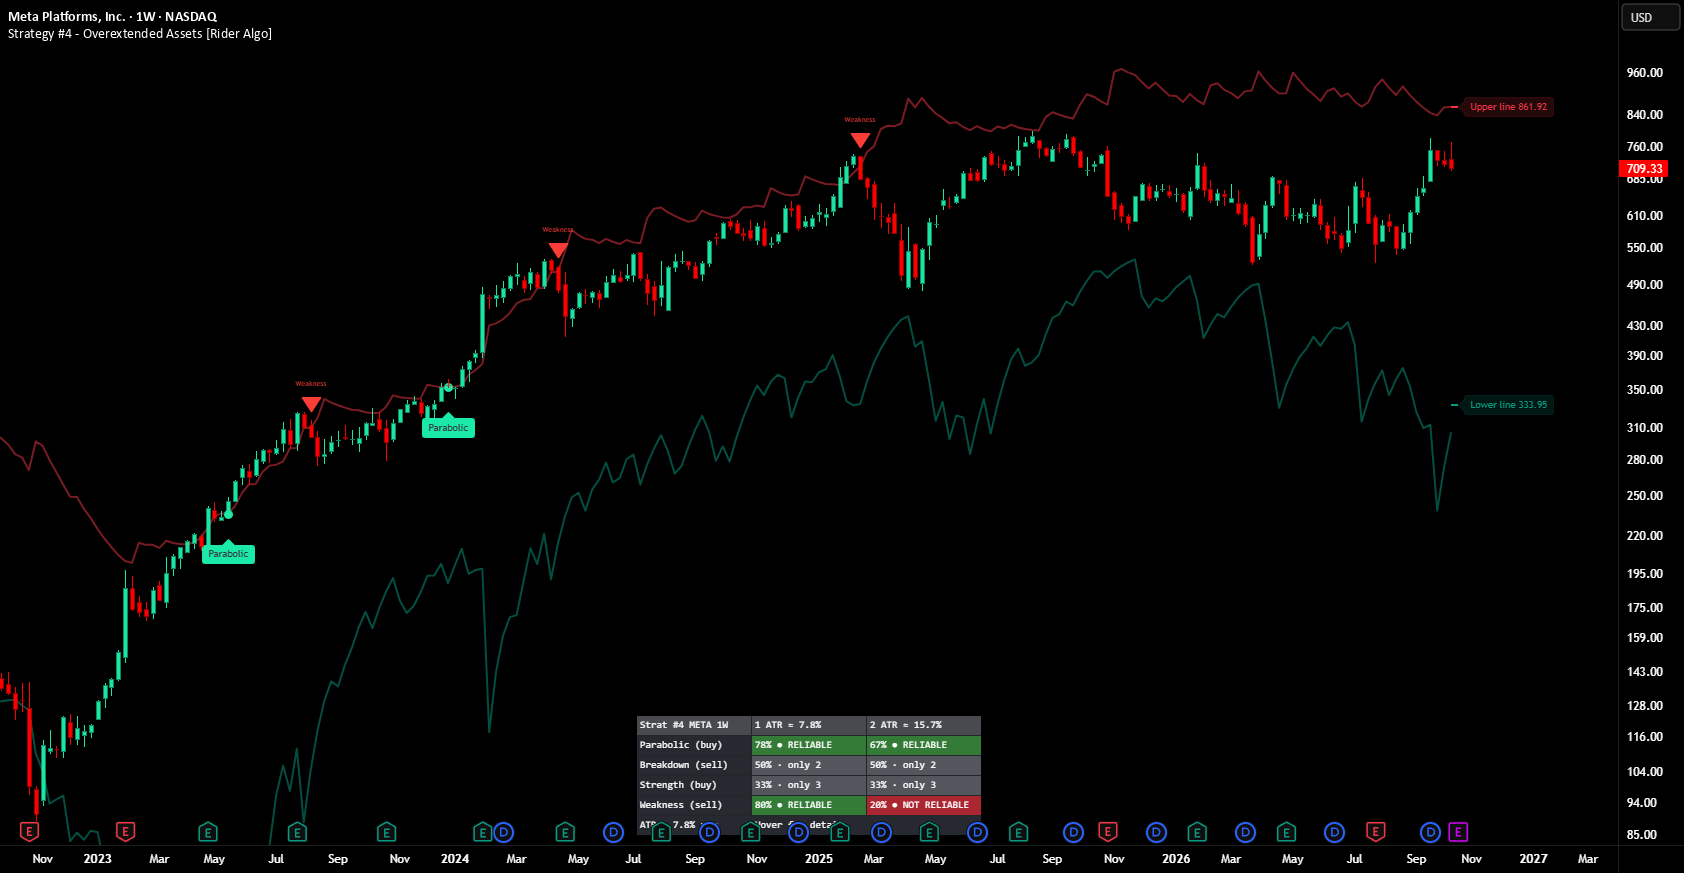
What it does
Strategy #4 turns the RSI's overbought and oversold levels into two price lines on your chart, so you can see where a move becomes overextended before it gets there. A strong trend drives along the upper line, and the first time it bumps back into it after breaking out is often a better moment to join than the breakout itself.
How to read it
- Read the table first. Give more weight to the signals marked RELIABLE on this chart.
- ARMED with a price means a breakout is waiting for its first pullback, and that price is known before the candle opens. Traders often rest a buy limit there.
- Parabolic Entry (green label) confirms the pullback at the close of the candle.
- Weakness marks the end of an extreme stretch up: protect profits, take partials or tighten the stop.
- Strength marks the end of an extreme stretch down: wait for price to come back near the lower line instead of buying the signal candle.
When to use it
- Strong trends that keep breaking out and pulling back.
- To manage an open long: T1 and T2 targets, plus the Weakness marker.
When not to use it
- To short strong assets: the short setup is off by default because it bets against the long-term drift.
How we tested it
Each signal type is judged separately on the chart you open, at one and two ATR moves over the next ten candles.