Toolkits · Volatility & breakouts
Probability Clouds + Entry Level
FreeA weather-style forecast of where price is likely to close over the next few candles.
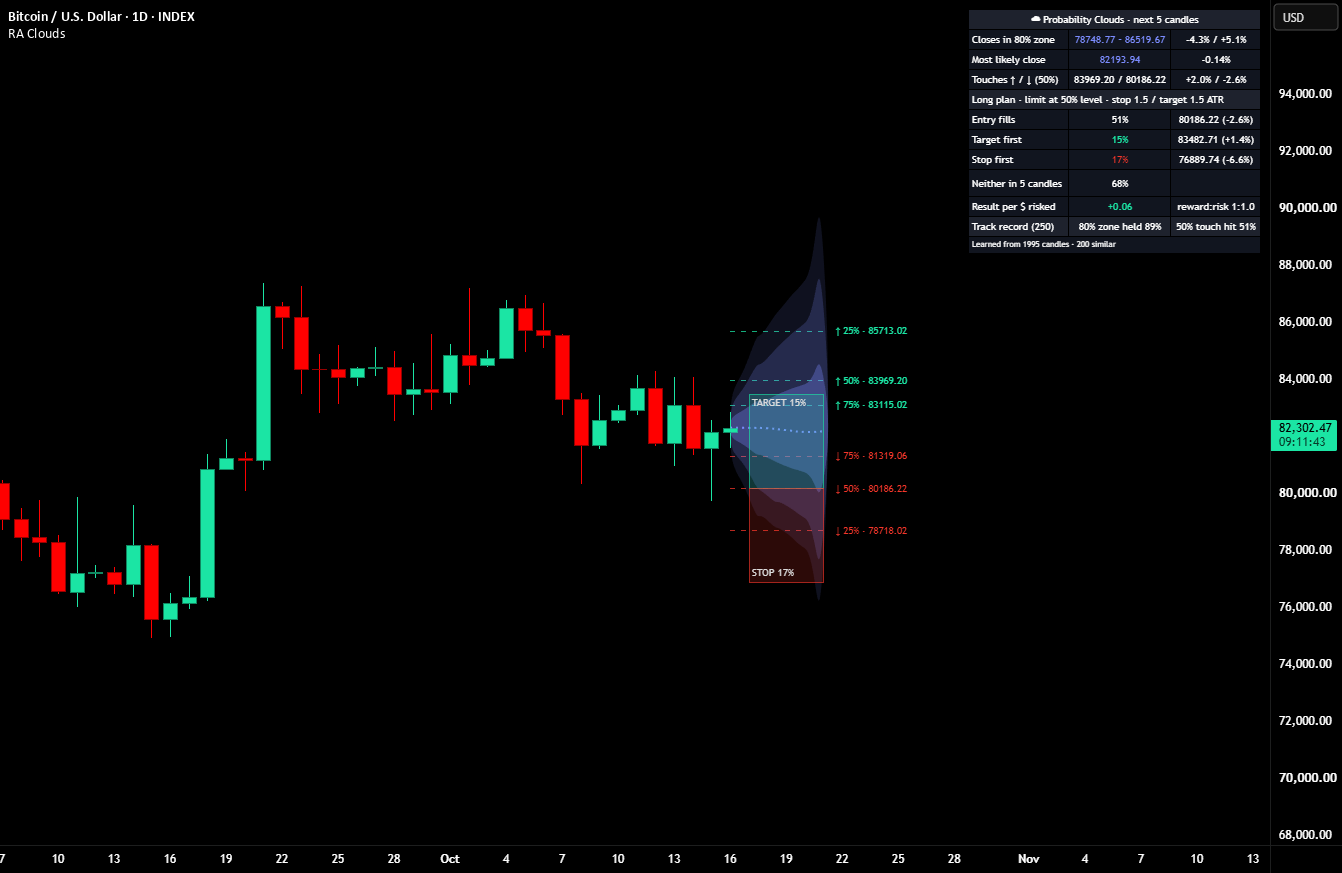
What it does
Probability Clouds draws a weather-style forecast to the right of the last candle: clouds that show where price is likely to close over the next few candles, levels that show how likely price is to touch each price, and an entry planner for limit orders. Like a weather map, it doesn't promise rain or sun; it shows how much it usually rains on days like today.
How to read it
- Check the track record in the table: it shows whether the clouds have been well calibrated on this chart.
- Read the width of the cloud before its lean. A wide cloud means big moves are normal right now.
- Touch levels tell you whether a limit order is likely to fill and whether a target is realistic in the time you plan to hold.
- The entry planner replays your exact entry, stop and target on similar past moments.
When to use it
- To place limit orders and targets at realistic distances.
- To size positions according to how much price usually moves from here.
When not to use it
- As a directional signal: the lean is context, not a prediction.
How we tested it
Forecasts were checked out of sample on crypto, stocks, gold and forex on daily, 4-hour and weekly charts. On your chart, the latest candles are forecast again with only the data available at each moment and checked.