For holders · Long-term holding
Macro BTC — for Holders
MembersA cycle map for Bitcoin holders: where to accumulate, where to take profits, and today's mood.
Best on: 1D, 1W
Included in Rider Algo Toolkit and Full Strategy Access
What it does
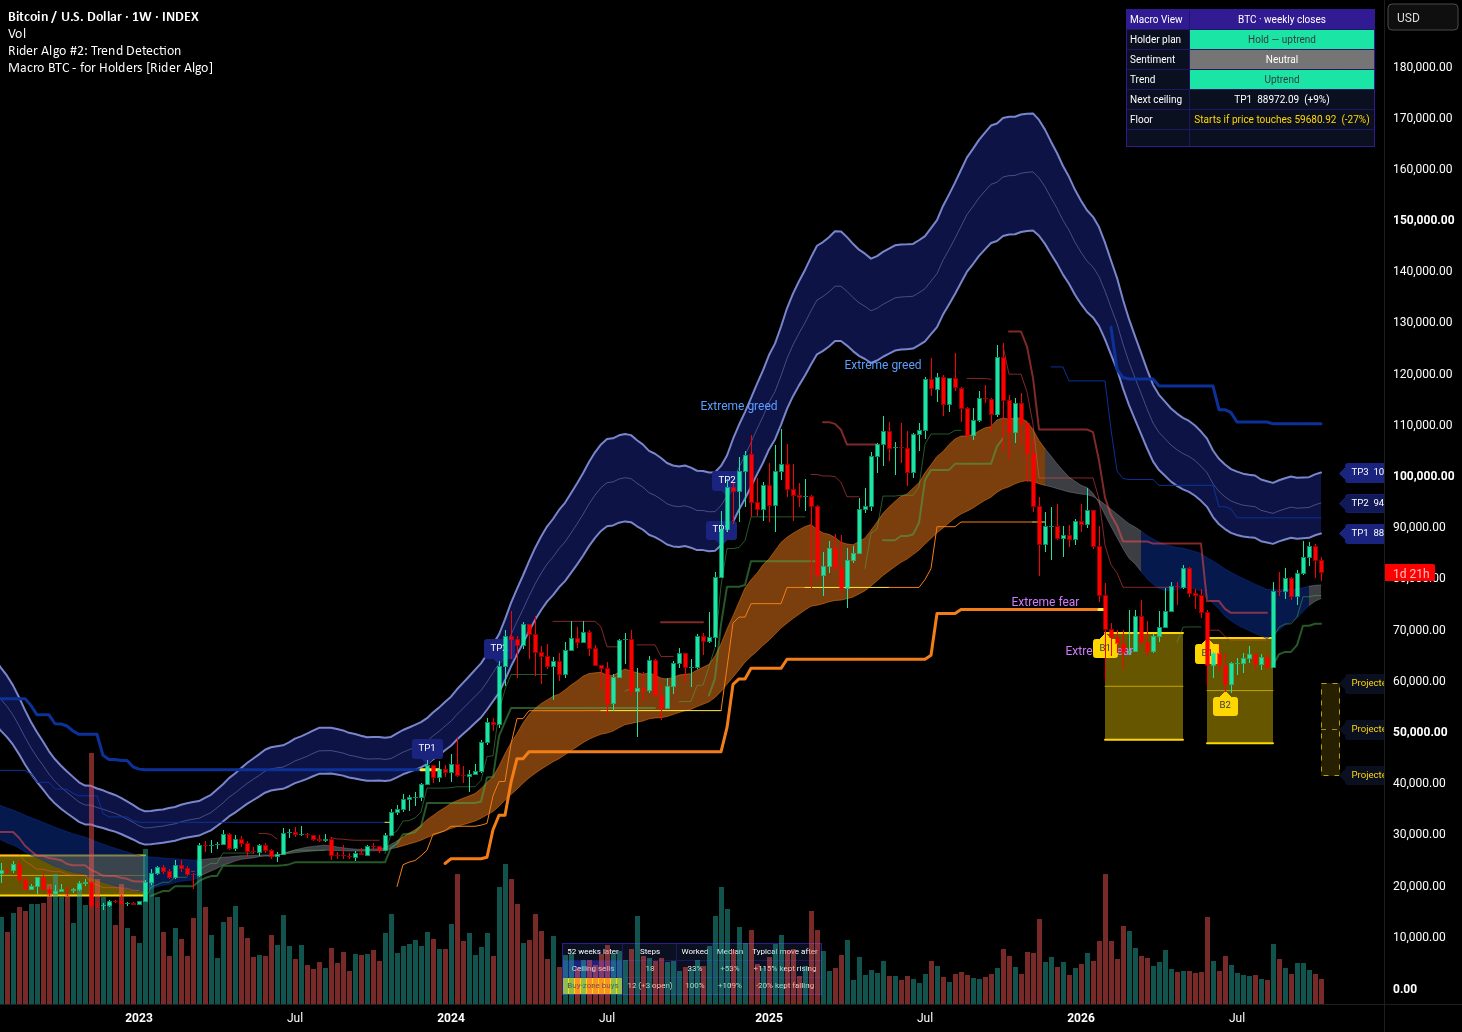
Macro BTC is a cycle map for Bitcoin holders. It marks where BTC has historically been stretched far above its trend (a blue zone to take profits in three steps), where it has been deeply discounted with exhausted momentum near its 200-week average (a gold zone to accumulate in three steps), and what the market mood is right now.
How to read it
- Read the Holder plan and Trend rows first. One line sums up the situation: accumulate, take profits, hold or wait.
- Gold zone (B1, B2, B3): consider accumulating in steps. It appears when weekly momentum is exhausted and price is near its 200-week average.
- Dashed gold box: where the next buy zone would start, fixed for the week.
- Blue zone (TP1, TP2, TP3): consider taking partial profits at each step.
- Sentiment shows the crowd's mood, from extreme fear to extreme greed.
When to use it
- If you hold Bitcoin for the long term and want to buy fear and sell greed with a plan.
When not to use it
- For short-term trades: everything is calculated from closed weekly candles.
How we tested it
The rules were calibrated on Bitcoin's weekly history since 2010, cycle by cycle. The results table on the chart shows what price did a year after every step.